


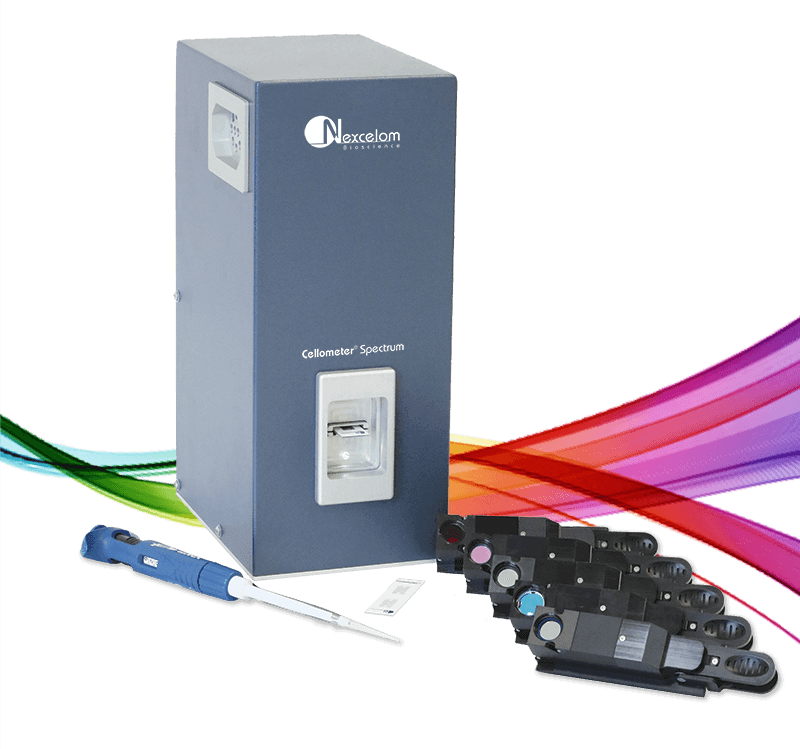
Cellometer Spectrum
Image Cytometry System for 20 µl Cell-Based Assays
Why Cellometer Spectrum?
- 20 µ Cell-Based Assays
- Unique Algorithms for Advanced Cell Analysis
- User-changeable Fluorescent Modules
Introduction to the Cellometer Spectrum
Whether you are looking for an affordable benchtop cytometer, or to improve your current Flow cytometry analysis, the Spectrum Image cytometry system will exceed your expectations not only in performance, data analysis and affordability, but also in its ease of use and application versatility.
All-in-One System
Basic cell counting, primary cell viability, and cell-based assays.Dual-Fluorescence for Accurate Primary Cell Viability
No interference from red blood cells. Analyze bone marrow, peripheral blood, and cord blood without lysing.Unique Algorithms for Advanced Cell Analysis
Determine concentration and viability of hepatocytes, adipocytes, and other sophisticated cell types.Fast Results
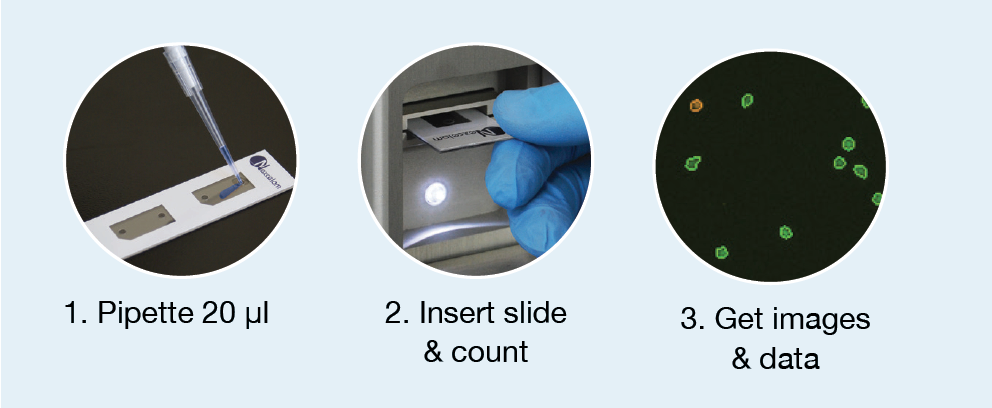
Obtain cell images, counts, size measurements and viability calculations in < 30 seconds per sample.Simple 20 µl Cell-Based Assays
GFP | Apoptosis | Cell Cycle | Cell Mediated Cytotoxicity | Cell Counting & Viability
- Accurate Cell Counting
- Versatile Analysis and Applications
- Pre-qualified Reagents
- Pre-defined Instrument Settings
- Assay-Specific data templated
- Export to FCS Express* (Flow like data analysis)
Cell Types for Many Research Areas
Cellometers are optimized for primary cell analysis
PBMCs
Stem Cells
Adipocytes
Neural Cells
Hepatocytes
Dendritic Cells
Epithelial Cells
Keratinocytes
Lymphocytes
Splenocytes
Monocytes
- Clinical Immunology: PBMCs
- Diabetes / Obesity: Adipocytes
- Immunotherapy: Leukocytes
- Microbiology: Yeast (Spectrum 10x)
- Oncology: Cell Lines
- Regenerative Medicine: Stem Cells
- Toxicology: Hepatocytes
- Transplantation: Nucleated Cells
- Vaccine Development: Splenocytes
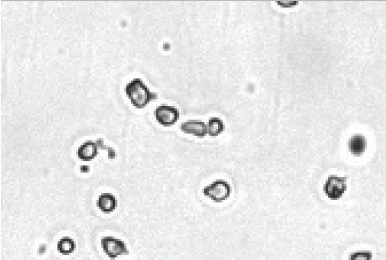
Accurate Cell Counting
Bright Field
Stained AO+ Cells
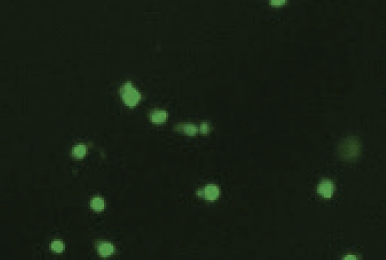
Counted AO+ Cells
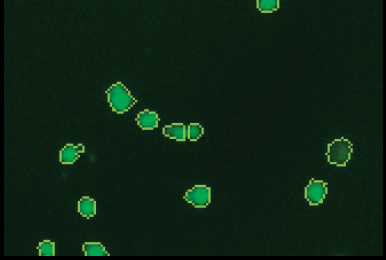
- Automatic identification of Acridine Orange (AO) stained cells (shown above)
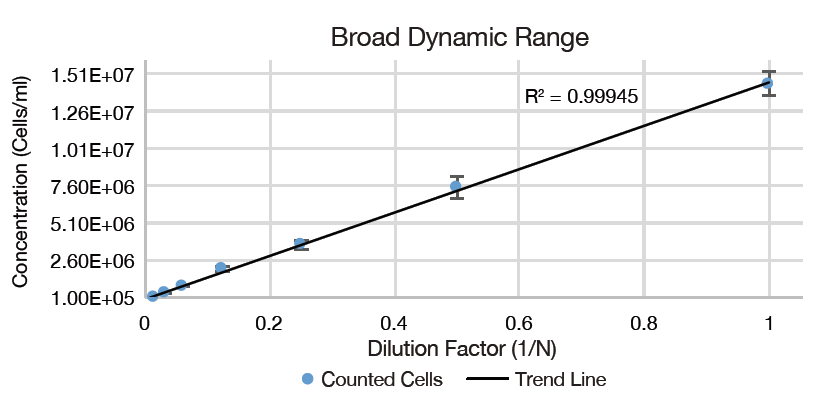
- Image and count up to 1.51x10⁷ cells/mL
- Image acquisition and analysis: 30 seconds/sample for a 3-channel assay
- Versatile platform - use for routine cell counting and complex cell-based assays
Export to FCS Express* for Flow-Like Data
Counted PI+ Cells
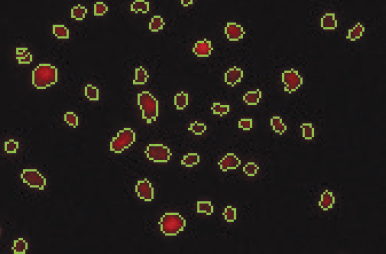
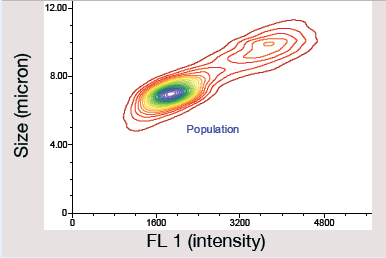
Contour Population Plot
- Export image data into flow cytometry software: FCS express
- Simple work flow: No fluid- stream, No PMT voltages, No forward/side scatter
- Easily perform data analysis using pre-designed templates
- Quickly plot cell population data as a: histogram, scatter plot, dot plot or contour plot
* FCS Express Flow Cytometry software is a product of De Novo Software and is included with the Cellometer Spectrum
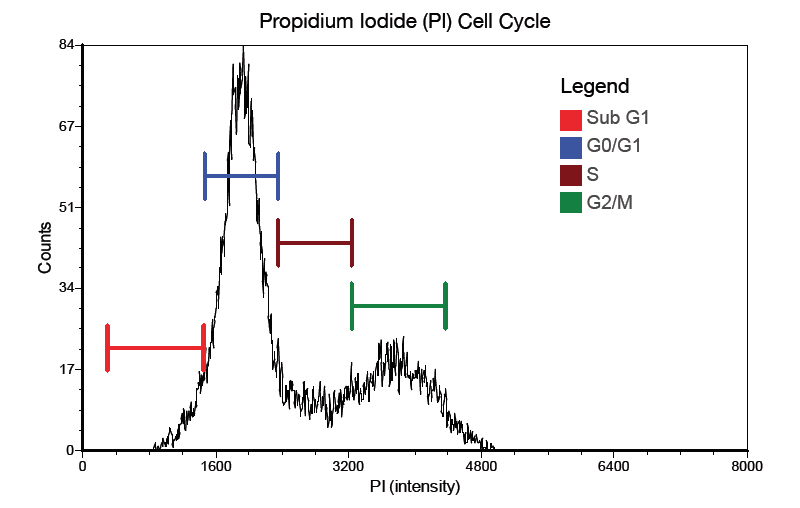
| Cell Population | % of Gated Cells | Concentration (10^6 cells/mL) |
|---|---|---|
| Total | 100 | 9.2 |
| Sub G1 | 4.7 | 0.1 |
| G0/G1 | 58.0 | 5.8 |
| S | 13.4 | 1.3 |
| G2/M | 23.9 | 1.9 |
User-Changeable Fluorescence Optics Modules*
Cellometer assays use specific optic modules for maximum performance and discrimination between fluorescence channels. Standard modules are listed in the table below. Custom fluorescence optics modules are also available.
| Optics Module | Fluorophores | Nucleic Acid Stains | |
|---|---|---|---|
| VB-450-302 Ex: 375 nm Em: 450 nm |
AlexaFluor® 350 CFP |
DAPI Hoechst 33342 Hoechst 33258 |
|
| VB-535-402 Ex: 475 nm Em: 535 nm |
GFP Calcein FITC AlexaFluor® 488 |
AO (acridine orange) SYTO®9, SYTO®13 SYTOX®Green SYTO®BC |
|
| VB-595-502 Ex: 525 nm Em: 595 nm |
AlexaFluor® 546 AlexaFluor® 555, Cy3® PE (R-phycoerythrin) Rhodamine B |
PI (propidium iodide) EB (ethidium bromide) SYTOX® Orange |
|
| VB-660-502 Ex: 540 nm Em: 660 nm |
RFP 7-AAD Nile Red |
PI (propidium iodide) EB (ethidium bromide) |
|
| VB-695-602 Ex: 630 nm Em: 695 nm |
AlexaFluor® 647, Cy5® APC (allophycocyanin) |
SYTOX® Red | |
*This table is a partial list of compatible fluorophores, nucleic acid stains, and fluorescent proteins. Please contact Nexcelom technical support regarding compatibility of other reagents.
Sytox, AlexaFluor, and Cy are trademarks of Life Technologies.