

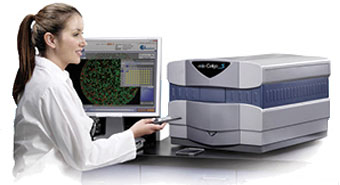
Celigo Imaging Cytometer
Microwell plate based image cytometer for adherent and suspension cells
Introduction to Celigo
Celigo® is a bench-top, micro-well plate based, bright field and fluorescent imaging system.Bright Field Imaging for All Well Sizes
The Celigo Image Cytometer provides the best-in-class bright field imaging for all well sizes.Bright Field & 4 Fluorescent Channels
Bright field and four fluorescent channels (UV to Far Red) for analyzing & quantifying multiplex assays.Data Visualization
Convenient data visualization environment that facilitates data interpretation.API & Data Management
Application programing interface (API) and data management solution for integration into automated workflows.Customized Applications
Customized applications for each assay - ready-to-use, does not require any image analysis expertise.Automation
Automated microplate handling for either kinetic end-point analysis or time-point analysis.
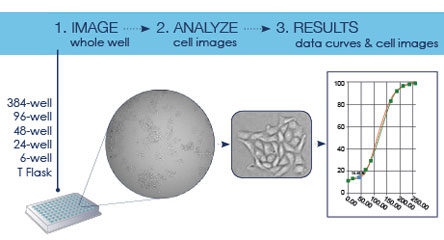
The Celigo Cell Cytometer Counts Every Cell in Every Well
Celigo® S is a bench-top, micro-well plate based, bright field and fluorescent imaging system. The best-in-class bright field imaging capability, in combination with 4 fluorescence channels, provide high speed, fully automated imaging and quantification of suspension, adherence cells, tumor spheroids, iPSC and cancer stem cell colonies within 6, 12, 24, 48, 96, 384, 1536-well plates, T flasks, and slides.
Proprietary optics and scanning system enable fast imaging of entire well, while maintaining consistent illumination and contrast out to the well edge, for accurate identification of all cells within each well.
With an intuitive software interface and optional integration into automation platforms, the Celigo provides labs with increased capabilities.
The Celigo S Image Cytometer Provides the Best-in-Class Brightfield Imaging for All Well Sizes
Excellent Optics for Enhanced Image Quality
Improve brightfield optical image quality at the edge of wells and eliminate edge optical distortion using an F-Theta lens for superior well edge-to-edge image contrast.
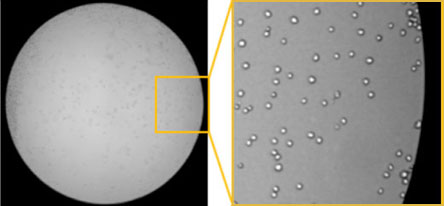 Figure 1a: Brightfield image taken with Celigo Imaging Cytometer at the edge of a well on a 96-well microplate showing enhanced image quality and contrast.
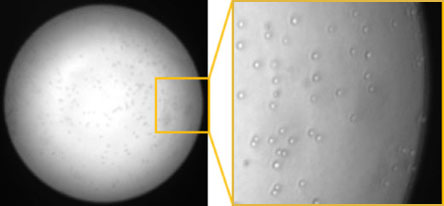 Figure 1b: Brightfield image taken with conventional microscope showing distortion and low contrast near the edge of the field-of-view.
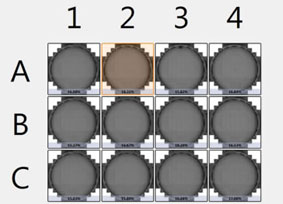 Figure 2a: Example of 12-well plate acquisition using Celigo Imaging Cytometer.
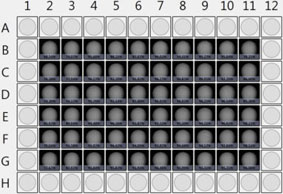 Figure 2b: Example of 96-well plate acquisition using Celigo Imaging Cytometer.
Fast Plate Scanning for Image Acquisition and Analysis
Increase the speed of plate acquisition dramatically using novel plate scanning technology for fast acquisition. Scan a 384-well plate in brightfield in 2 min.
Ability to Scan a Variety of Plate Vessels
Scan wells of any size using automated image stitching that can view and quantify cells and colonies in vessels up to 6-well plates and 10 cm dishes.
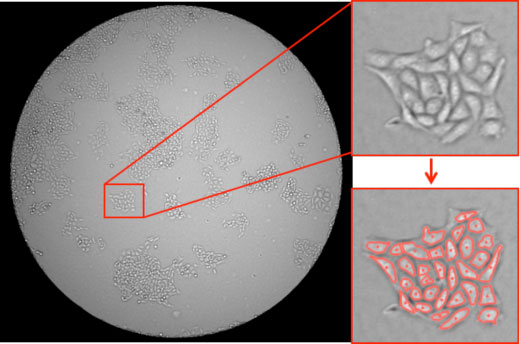 Figure 3: Brightfield image of a well on a 96-well microplate showing counted cell colonies across the well.
Accurately Quantify Cells and Colonies
Accurately quantify all the cells and colonies in the well even if they do not grow uniformly across the wells.
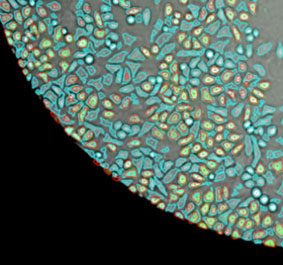 Figure 4: Brightfield image of a well on a 96-well microplate showing counted adherent cells.
Accurately Measure Adherent Cells without Trypsinization
Analyze your cell sample without trypsinization to avoid losing cells and look at cells right where they grow over multiple scan times.
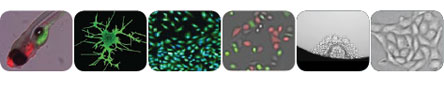
Brightfield and Four Fluorescent Channels (UV to Far Red) for Analyzing & Quantifying Multiplex Assays
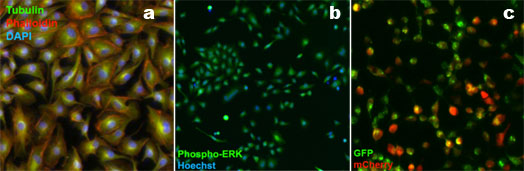 Figure 5: Fluorescent images acquired with Celigo Imaging Cytometer of (a) Tubulin, Phalloidin, and DAPI, (b) Phospho-ERK and Hoechst, and (c) GFP and mCherry.
Brightfield and Multi-Channel Fluorescence Imaging
Use a combination of brightfield and fluorescent imaging allowing the development of multi-color assays ranging from UV to Far Red.
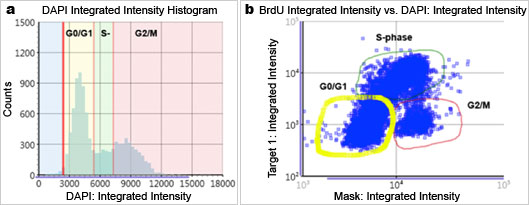 Figure 6: Flow-like data analysis and presentation generated by Celigo Imaging Cytometer. Fluorescence intensity (a) histogram and (b) scatter plot.
Powerful Image Analysis Software
Identify cell populations based on a variety of parameters such as morphology measurements or fluorescence intensities using a flow-like gating interface with histogram and scatter-plots graphics.
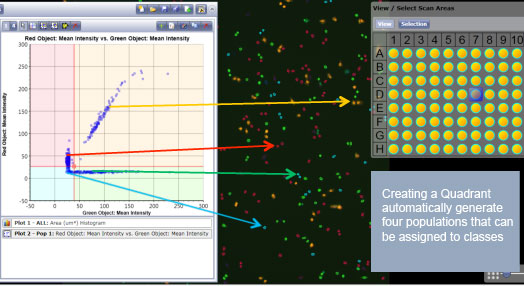 Figure 7: Correlation of gated scatter plot data to counted cells on acquired images.
Clear Visualization of Image and Data Correlation
Correlate the cell populations identified in gates with the cells visualized in the image using color coding overlays.
Convenient Data Visualization Environment that Facilitates Data Interpretation
Simple At-a-Glance Plate-Based Data Review
Quickly evaluate data from well to well using an at-a-glance view for each plate
Simple At-a-Glance Plate-Based Growth Curves
Generate time course growth curves and display them in a plate overview for at-a-glance data review.
Easy Brightfield and Fluorescent Image Navigation
Navigate between plates, wells and time points to look at your cells growing in specific well locations.
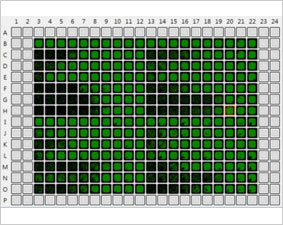 Figure 8: 384-well plate view of wells showing cell confluency on the plate.
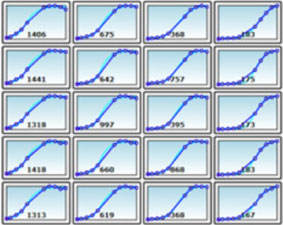 Figure 9: Time-course data plot generated by Celigo Imaging Cytometer.
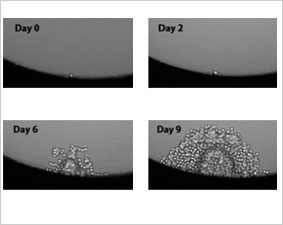 Figure 10: Brightfield image of a single cell colony observed at the same location of a well on a 96-well plate.
Application Programing Interface (API) and Data Management Solution for Integration into Automated Workflows
Integrate with Robotics
Automate your assays by running the Celigo under the control of a scheduling software and integrate with robotic arms, plate stackers, automated incubators and liquid handlers.
Automated System for High Throughput Integrated Data Acquisition and Analysis
Acquire images and data analysis of hundreds of plates 24/7 automatically.
Flexible Data Analysis Method for Multiple Users
Analyze large data sets off the Celigo instrument using the Celigo Satellite Workstation and free up Celigo time to acquire more plates.
Easily Access and Manage Data using Celigo Network Database
Facilitate access to your imaging data using the Celigo network database and connect multiple instruments and satellite workstations to seamlessly acquire and analyze your data from a convenient centralized location.
Series of Customized Applications for Each Assay - Ready to Use, Does Not Require Any Image Analysis Expertise.
Label-Free Brightfield Cell Analysis
Take advantage of label-free brightfield applications to avoid staining cells with toxic dyes or transfecting with fluorescent reporters.
Numerous Cell Characterization Assays
Analyze images for cell counting, confluence, colonies and 3D-spheroids.
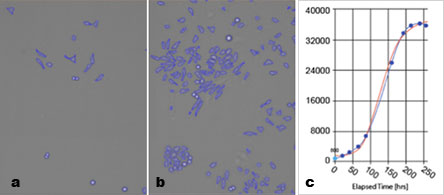 Figure 11: Label-free brightfield cell counting and from (a) low count to (b) high cell count which can be used to directly generate (c) a cell growth curve.
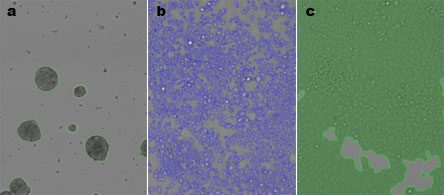 Figure 12: Label-free brightfield cell counting of (a) spheroids, (b) cell counting, or (c) confluence percentage.
Ability to Export Brightfield and Fluorescent Images for Publications
Capitalize on the Celigo brightfield and fluorescent image quality to take images of your cells for your records and strengthen your publications.
Time-Saving Data Processing Method
Get data on the fly by acquiring and analyzing image simultaneously.
Easy-to-Use Preset Assay Parameters for Quick Data Analysis
Perform Celigo assays using pre-defined parameters that require very few modifications from the researchers.
Simple and Intuitive Software User Interface
Benefit from a simple and intuitive 4 steps software workflow to run all your assays.
Take Your Analysis to the Next Level, Automation!
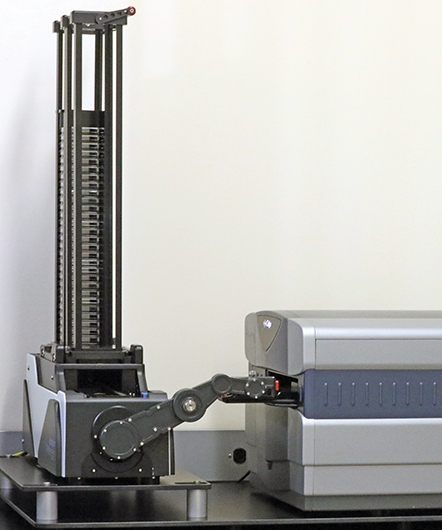
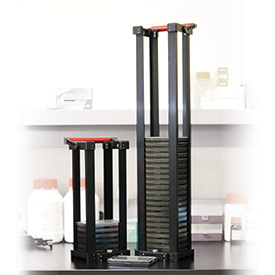
Stacker Automation: No Need to ‘Baby-Sit’ Your Plates
With the simple integration of the plate stacker, you are free to work on other tasks while Celigo screens your stack of plates.
- Up to 50 plate capacity
- 15 sec transfer rate between plates
- Data exports automatically for each plate
- Handles plates with or without lids
- Accommodates from 6-well up to 1536-well plate formats
- Fits on standard lab bench
- Ideal for endpoint assays
- Easy to add on to existing Celigo instruments
| Parameter | Specification | |||
|---|---|---|---|---|
| Celigo only Dimensions | 19 inch wide x 29 inch long x 17 inch high (with plate holder extended) | |||
| Celigo + Stacker Dimensions | 25 inch wide x 44 inch long x 40 inch high (Total) | |||
| Electrical Power | 5 Electrical outlets needed at 100-240VAC 50/60Hz (30Amps Total) | |||
| Compressor (sold with Stacker) | 1.2 CFM @ 90 PSI with 1 gallon tank | |||
| Operating Temperature | 15 ºC to 25 ºC | |||
| Operating Humidity | 10% to 90% RH, non-condensing | |||
| Instrument Shipping & Storage Temperature | -18 ºC to 65 ºC | |||
| Instrument Shipping & Storage Humidity | 10% to 90% RH, non-condensing | |||
| Manufacturer |
|
|||
| Distributor/Support | Obtain information at http://www.nexcelom.com/purchase or contact support@nexcelom.com |